The UrbanData2Decide project has partly been about getting to know local government administrators and understanding more about the types of data related challenges they face when policymaking. One common refrain is that there simply isn’t enough information, and what there is goes out of date quite quickly. Hence decisions have to be made on common sense, instinct or ideology. One of the beliefs guiding the setup of the UD2D project was that social media data might be able to ameliorate this situation.
In particular, one project we’ve been working on concerns the use of point of interest data coming out of OpenStreetMap as a way of providing a picture of the urban environment (for example locations of venues selling alcohol). Collaborative mapping tools such as OSM can offer a very rich picture of local life, as they are created by people who live in the local area.
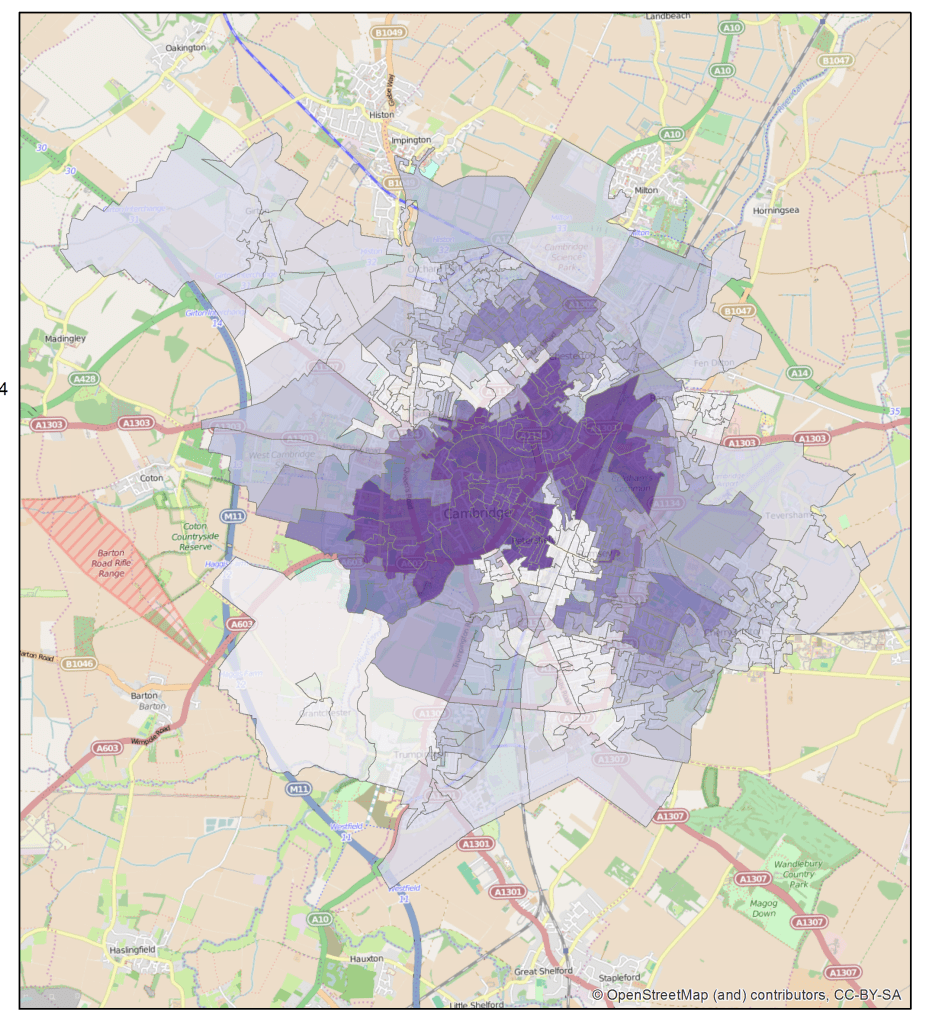
A first task in the use of this sort of data concerns its validation – how accurate is it? Hence what we’ve been trying to do, looking at OSM data, is determine how complete it is, and how this completeness varies by area. You can see such a validation applied to Cambridge above (darker zones are more “complete” mappings). Clearly there is important variation in how complete the data is, and this variation isn’t randomly distributed (seems to be more complete in the city centre). In later work, we’ll be looking more systematically at what explains this type of variation.
NB This work was produced in conjunction with Stefano de Sabbata while he was a fellow at the OII.