

Dr Fabian Stephany
Departmental Research Lecturer
Fabian is a Departmental Research Lecturer in AI & Work at the Oxford Internet Institute.

In times of economic crisis, researchers and policymakers need reliable and recent data to model shocks, forecast economic repercussions, and distribute aid. We, a team of international researchers, have developed an automated tool to measure the risk companies see in the Covid-19 pandemic: the CoRisk-Index. While the index focuses on real-time data on the Coronavirus pandemic, the methodology of the CoRisk-Index can be extended to other economic crises, such as “trade wars”.
Our global economy is complex and interconnected but, at times, also fragile, as the Covid-19 pandemic revealed. During the pandemic, economies are affected in various ways: travel bans set business meetings off schedule, economic shocks disrupt global supply chains, and store closures erase customer demand. However, the pandemic does not hit all parts of the economy simultaneously. Some sectors might face particular risks that are of less relevance in other industries. So how can we measure the risks associated with the Coronavirus crisis in different sectors of the economy? To address this question and provide policymakers and researchers with real-time data on the economic risks of the pandemic, we have developed the CoRisk-Index. It is the first economic indicator measuring industry risk assessments related to Covid-19 since the start of the pandemic in early 2020 (see our blog post from April 2020).
We describe the methodology underlying the CoRisk-Index in great detail in an article recently published in Humanities and Social Science Communications, a Nature journal [1]. Briefly, the index consists of two main components: (a) the frequency by which firms speak about the Coronavirus and (b) the sentiment they attach to these statements. We examine both aspects in official company reports filed to the U.S. Securities and Exchange Commission (SEC). The so-called 10-K reports have two unique features. First, they are written in plain English, making them easily readable for natural language processing. Secondly, companies have a strong incentive to truthfully report their risk exposure as they neither want to scare off investors nor cause unwanted legal liabilities. The following figure illustrates how the two central metrics of the CoRisk-Index resonate with economic developments throughout the Covid-19 pandemic.
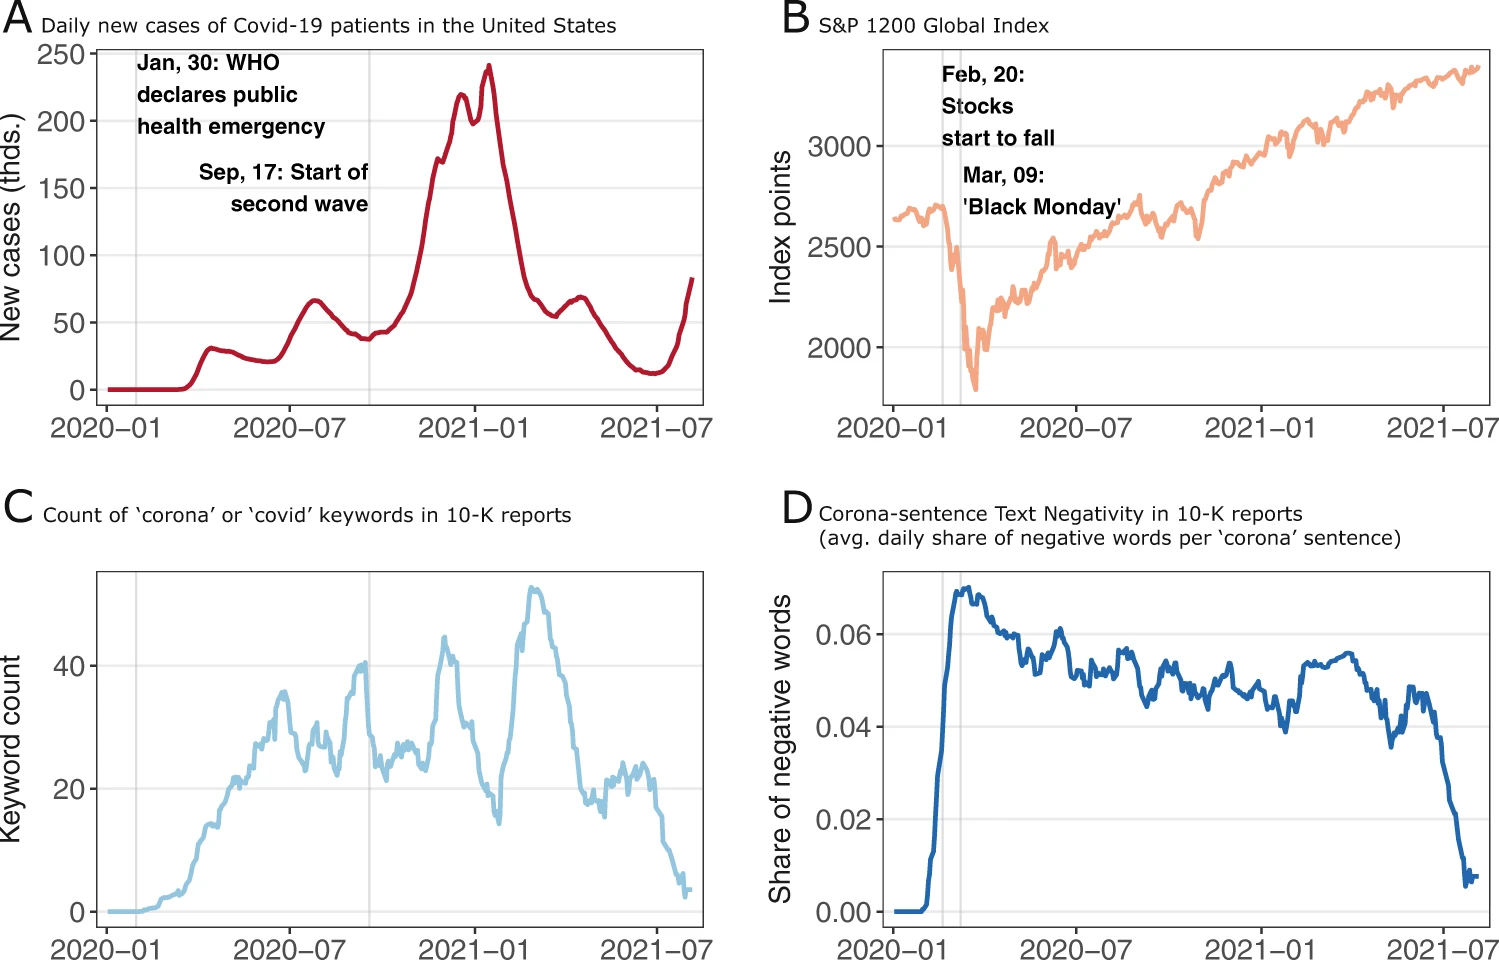
The risk perceptions captured by the reports shows early reactions to the unfolding crisis, even before the number of Covid-19 cases surged in the United States in early 2020 (A). Before the first wave hit the country, the number of ‘corona’ keywords in 10-K reports rose steadily (C). Subsequently, the number of corona keywords oscillated with peaks in June, September, and December 2020, reflecting waves of economic concerns about the pandemic. These oscillations overlap with the infection waves. Similarly, before the stock markets plummeted on February 20th 2020 (B), the text negativity (average share of negative words in sentences mentioning ‘corona’ or ‘covid’ in the 10-K reports) spiked in early February 2020 (D). It peaked at a share of 7% negative words per corona sentence just before the most severe stock market losses (‘Black Monday’) on March 9th 2020.
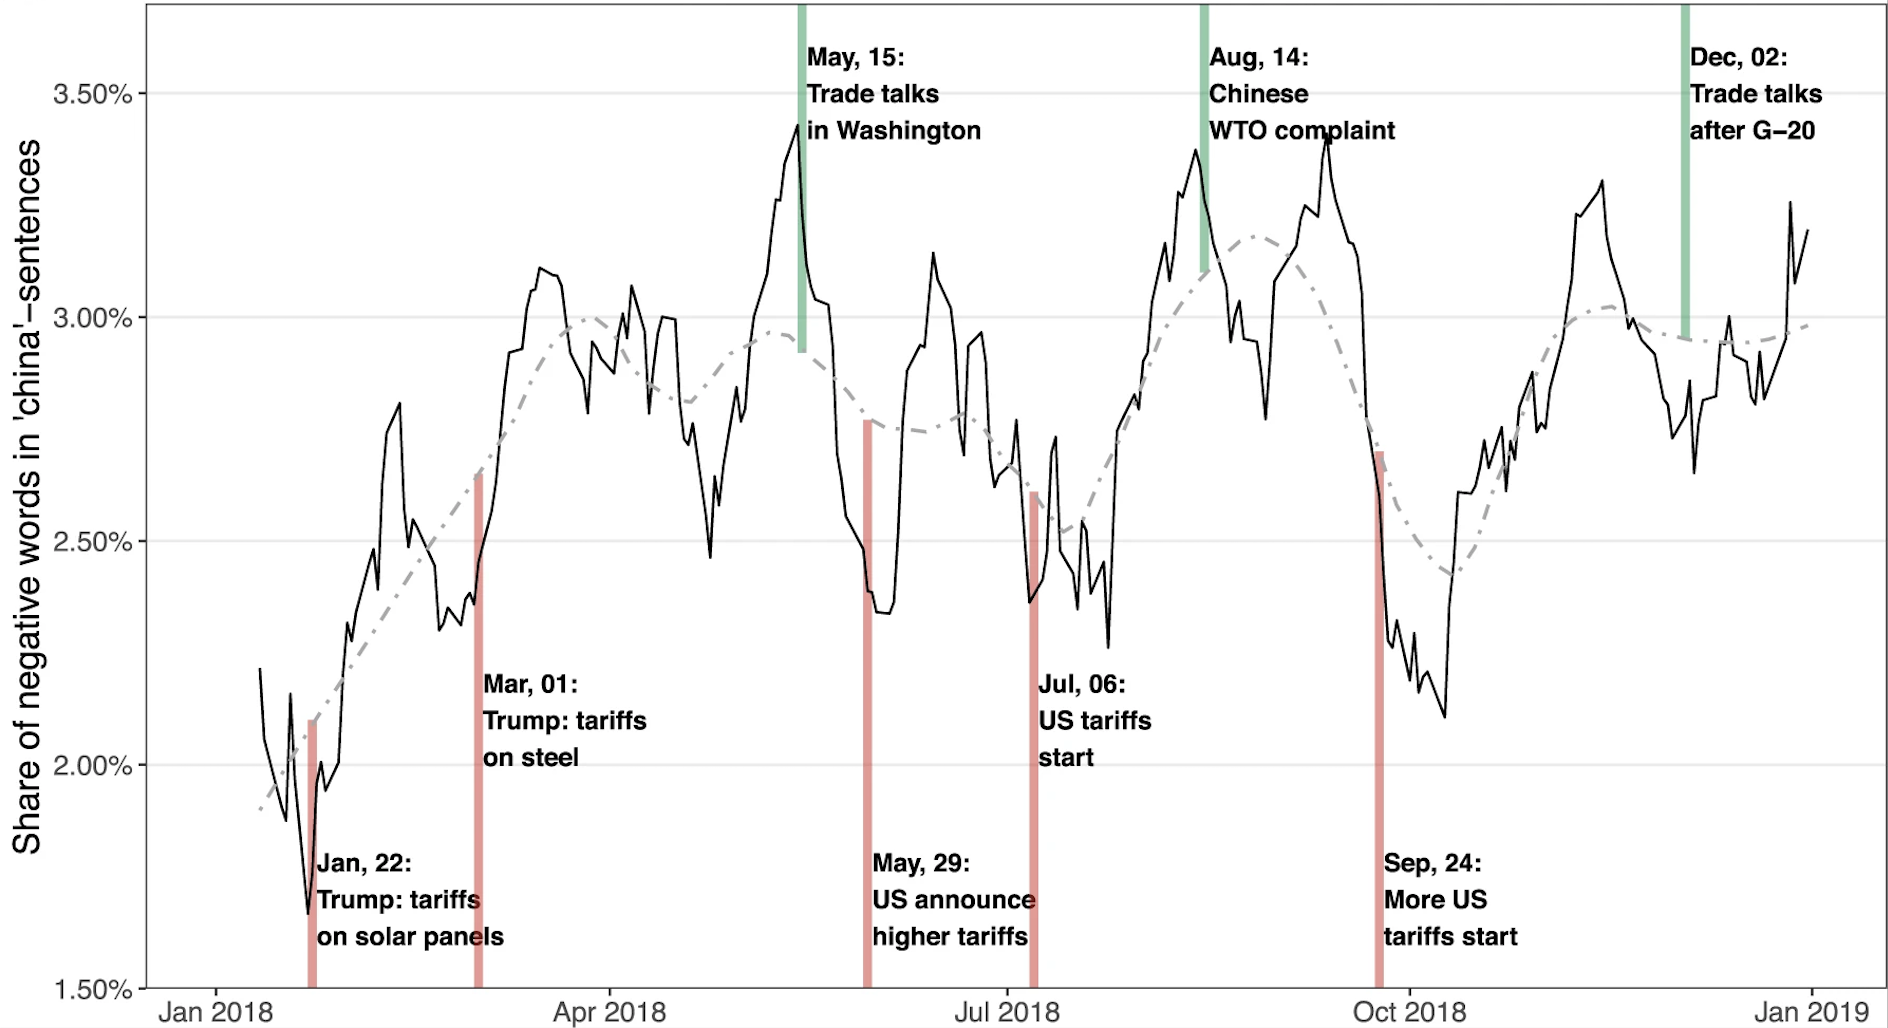
2022 might be the year that marks the end of the pandemic, but the methodology underlying the CoRisk-Index can be generalised to other contexts, too. In our paper, we demonstrate this with the example of the ‘US-China trade war’ of 2018. The figure below shows the share of negative words in sentences mentioning the keyword ‘china’ in company reports. The negativity varies between 1.7% and 3.4% throughout the trade war, with tariff announcements correlating with sharply increasing negativity and relaxing events such as trade talks with decreasing text negativity. This illustrates that the “CoRisk methodology” provides a flexible tool to track business risk perceptions in various contexts using freely available online data alone.
The CoRisk-Index reflects the dynamically evolving economic perspectives during the ups and downs of the crisis. The index complements more traditional economic risk measures, as it nowcasts how businesses perceive their corona-related risk exposure with real-time online data. The methodology is not limited to the pandemic, as the example of the ‘US-China trade war’ shows. The CoRisk-Index is updated every week in an interactive online dashboard throughout the crisis. It allows researchers and the general public to view how industries assess economic risks related to Covid-19.
[1] Stephany, F., Neuhäuser, L., Stoehr, N. et al. The CoRisk-Index: a data-mining approach to identify industry-specific risk perceptions related to Covid-19. Humanit Soc Sci Commun 9, 41 (2022).
Departmental Research Lecturer
Fabian is a Departmental Research Lecturer in AI & Work at the Oxford Internet Institute.

Departmental Research Lecturer
Dr Fabian Braesemann is a Departmental Research Lecturer in AI & Work at the OII.

Doctoral Candidate, Centre for Digital Governance, Hertie School, Berlin

Visiting Research Fellow
Ole an affiliated guest researcher at the Copenhagen Center for Social Data Science and is co-founder of the DWG Data Science Company,