Skip down to main content

Mapping Twitter

Published on
3 Dec 2016
Written by
Mark Graham

I’ve been working with Antonello Romano to update some of our older research into the geography of Twitter.

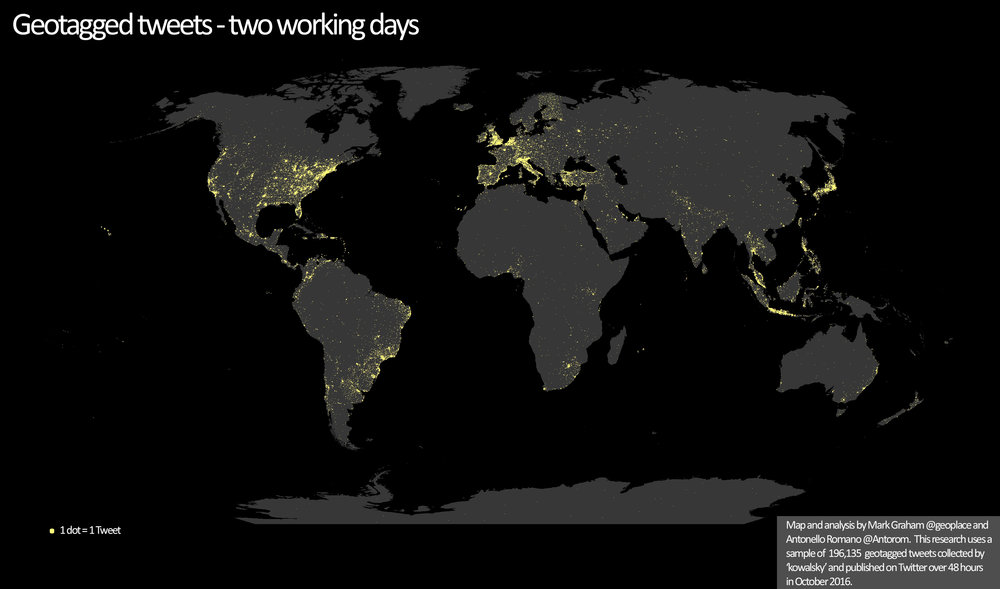
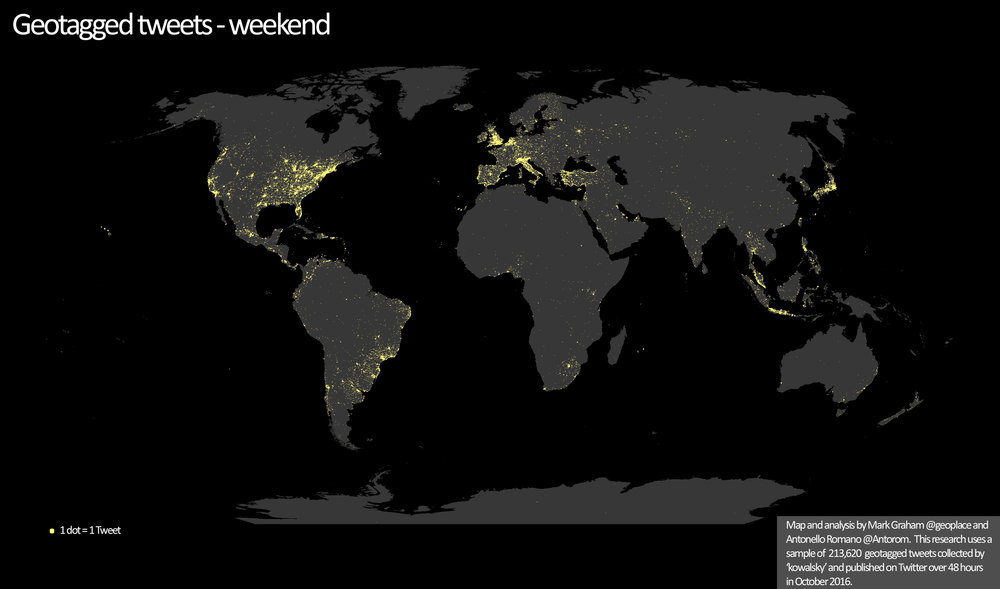
Below you can see some maps from a sample of about 2.5 million tweets collected worldwide over 48 hours in October 2016. These are collected using the Twitter streaming API (at most a 1% sample).

Because of the nature of the data, I wouldn’t read too much into any specific differences. But what these maps broadly achieve is that they give us a sense of the digital cores and peripheries of our world.

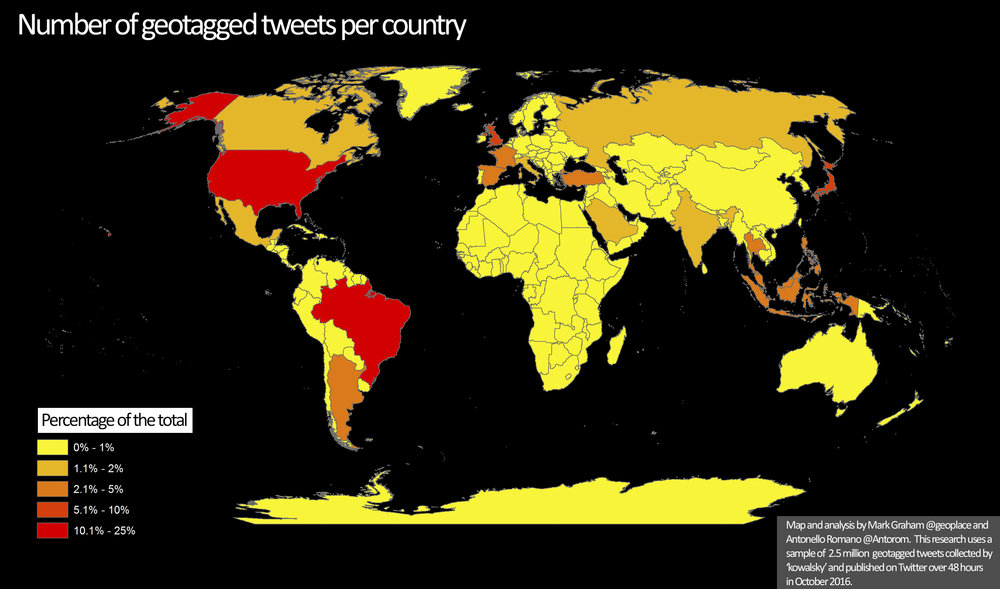
The two ‘world at night’ style maps give a sense of which parts of the world light up the internet with content, and which parts are still relatively left in the dark. The choropleth map (the one in which countries are shaded) then gives us a sense of which countries produce the bulk of content. The US (25%) and Brazil (14%) together produce more than a third of the world’s content.

Other parts of the world produce only a tiny amount of content in comparison. In all of Africa combined (2.7% of the world’s total), there are is less content produced than in Turkey (4%) or Spain (3%).

We live in a world in which almost half of humanity is connected to the internet. And almost anyone, anywhere, in any position of power is connected. This means that information in social media streams (like Twitter) can have an outsized influence. Knowledge shared on Twitter can shape how people around understand society, the economy, and politics. But, as we see here, that knowledge has distinct geographies. Let’s remember that even in 2016, this is anything but a truly global network.

Further reading:

Graham, M, S. Hale, and D. Gaffney. 2014. Where in the World are You? Geolocation and Language Identification in Twitter. The Professional Geographer 66(4) 568-578. (pre-publication version here)

Graham, M., De Sabbata, S., Zook, M. 2015. Towards a study of information geographies:(im)mutable augmentations and a mapping of the geographies of information Geo: Geography and Environment.2(1) 88-105. doi:10.1002/geo2.8

Graham, M. 2015. Information Geographies and Geographies of Information New Geographies 7 159-166.

Graham, M., S. Hale & M. Stephens. 2011. Geographies of the World’s KnowledgeConvoco! Edition.

2.5 million map.jpg
two_working_days_ok.jpg
Weekend_ok.jpg

Related Topics:

Privacy Overview
Oxford Internet Institute

This website uses cookies so that we can provide you with the best user experience possible. Cookie information is stored in your browser and performs functions such as recognising you when you return to our website and helping our team to understand which sections of the website you find most interesting and useful.

Strictly Necessary Cookies
  • moove_gdrp_popup -  a cookie that saves your preferences for cookie settings. Without this cookie, the screen offering you cookie options will appear on every page you visit.

This cookie remains on your computer for 365 days, but you can adjust your preferences at any time by clicking on the "Cookie settings" link in the website footer.

Please note that if you visit the Oxford University website, any cookies you accept there will appear on our site here too, this being a subdomain. To control them, you must change your cookie preferences on the main University website.

Google Analytics

This website uses Google Tags and Google Analytics to collect anonymised information such as the number of visitors to the site, and the most popular pages. Keeping these cookies enabled helps the OII improve our website.

Enabling this option will allow cookies from:

  • Google Analytics - tracking visits to the ox.ac.uk and oii.ox.ac.uk domains

These cookies will remain on your website for 365 days, but you can edit your cookie preferences at any time via the "Cookie Settings" button in the website footer.