1 Feb 2011
Today’s launch of police.uk by the Home Office provides the highest resolution mapping of crime data available in the UK to date. The website supports searches at the level of unit postcode (similar to a zip code) and returns results mapped at the street level. In previous UK crime maps these have typically focused on area aggregations using administrative or census geography (e.g., the London MET Police website). However, this new website appears to place points on maps at locations of where crimes have occurred… or does it? I will not argue here for the general merits of releasing crime data to the public in , or what does or should constitute a “crime”, nor those problems with how these events are recorded and georeferenced. Far better treatment of these issues is given by my PhD student Paul Richards over on his blog.
However, there appear to be some serious representational issues in this new mapping system which are not clearly documented and could be very misleading for the ill informed. Very generally, crimes will typically happen at a specific location, for example, a house could be burgled, or a person mugged. Ideally, this location would be represented as a point on a map where the event was recorded as happening.
In a US equivalent system (e.g. http://chicago.everyblock.com/) it is entirely possible to map these very precise locations as there are different privacy laws related to the disclosure of these sensitive data. However, in the UK, law requires more aggregate representations to be used, such as areas, and most typically being represented as choropleths. For example, you could show the frequency of burglaries or muggings that have occurred in a specific area.
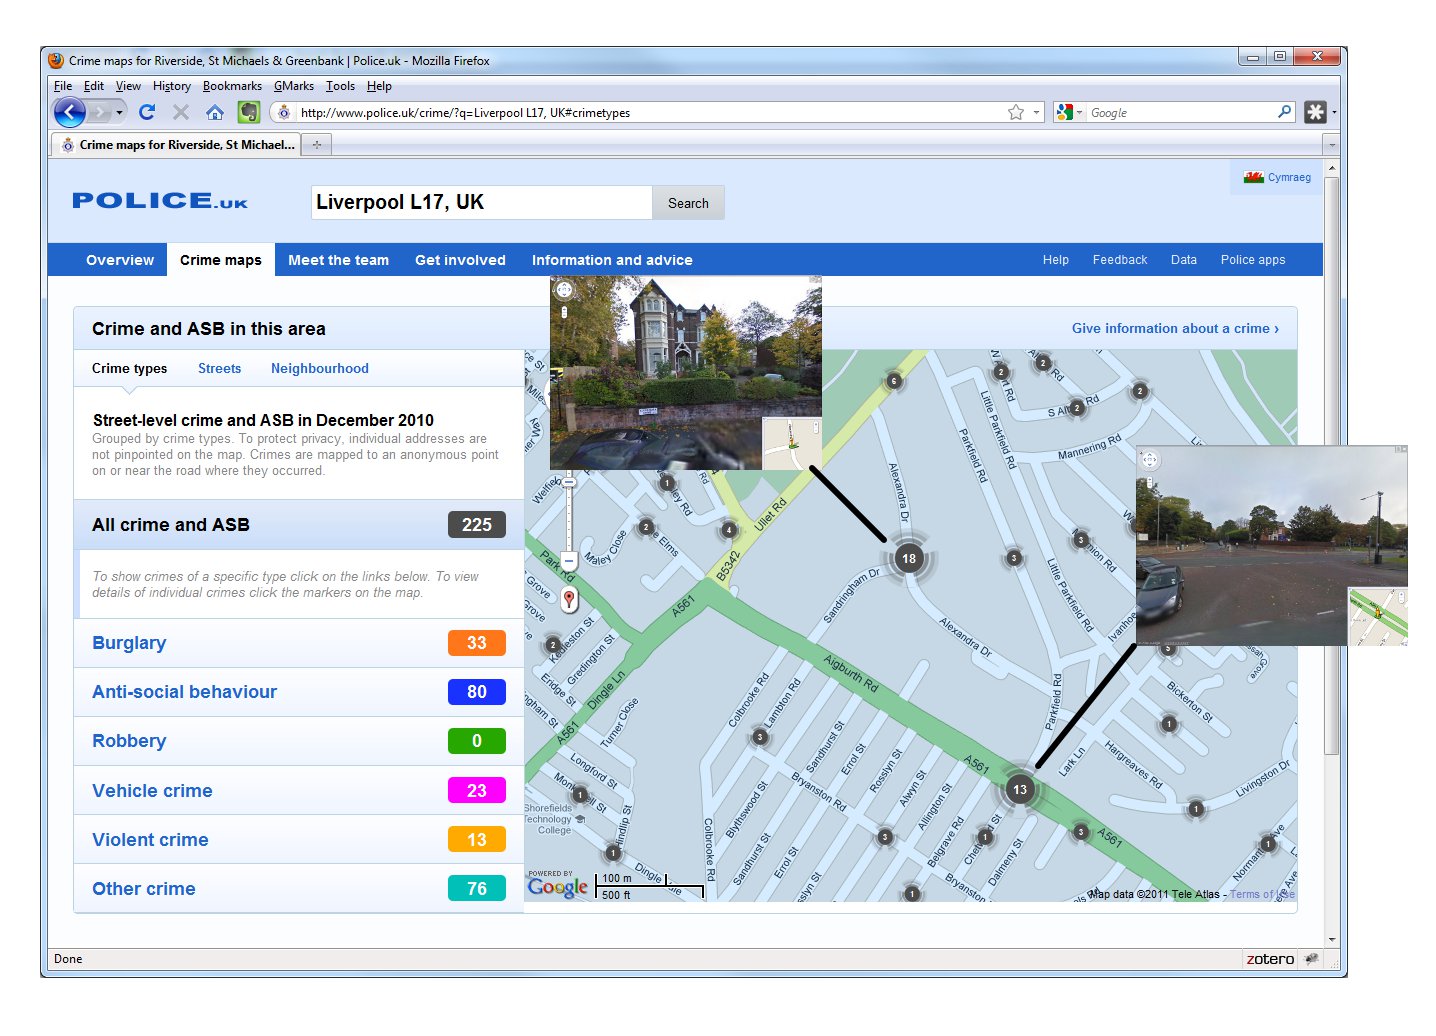 Although the documentation on launch was scant, it appears that the locations of crimes have been linked and aggregated by their nearest road segment, and that these have then been subsequently displayed as a point on the map. It is unclear whether this point is a randomly chosen along the road, or, whether this is the centroid of the street segment. Either way, it is a very poor representation of the data. Outside of issues related to how you appropriately position a point for very long road, if the street is going to be the aggregating unit for the data, then this should also be used for the visualization. For example, roads could have been variably colored for different rates of crime (rates not counts… this is another representation issue entirely!!). Systems are not a limitation here, using the combination of OpenStreetMap, Mapnik and OpenLayers it is entirely possible to build customized and bespoke online cartography. We do not have to rely on putting points on maps any more as our only representational option.
The problem with this website as it stands is that crimes are easily misinterpreted as happening at a very specific locations. If your house happens to be located next to one of these points it may suddenly appear to an uninformed user that there is a lot of crime in this specific area. For example, perhaps public order offensives related to a pub on a street are returned as occurring at a residential location. How might this effect a house price? Would household insurance rise?
These basic representational issues are typically covered in an undergraduate syllabus with a GIS component. To me at least this perfectly illustrates why Geography and GIS training is as important as raw technical skills when developing online mapping portals. This type of issue will not go away as these types of website become more prevalent as the open data movement grows; and more typically this are built by or without consultation with Geographers.
—
This guest post is written by Alex Singleton