The last post looked at mention activity for each British constituency. What would happen if we took these mentions to be votes? Does this reaction from social media offer any potential insight into what might happen in the election? In the image below (top), using the same week of Twitter data from Datasift and YourNextMP, we identify which party “won” the Twitter mention battle in each constituency. The blank constituency on the map is Buckingham (the speaker’s constituency), and we have of course excluded Northern Ireland and Plaid Cymru entirely, which was done purely to limit the number of parties and hence make the job a bit more feasible in real time.
Of course, as we highlight in the previous post, there is a strong relationship between the amount of times a candidate tweeted and the amount of mentions they got: and we don’t want to just measure how much effort candidates have been putting in online, but the relative level of attention they generate. Hence in the map we divide the overall number of mentions of a candidate by the amount of tweets they published themselves, giving us a kind of relative measure of a candidate’s impact on Twitter.
The map below ours is a constituency level forecast based on polling data for the purposes of comparison, lifted straight from our colleagues at electionforecast.co.uk.
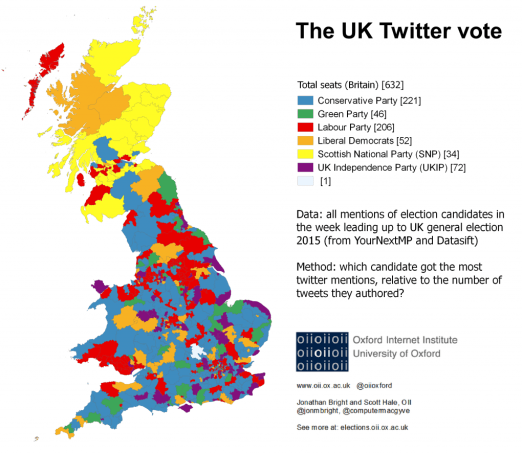
Constituency level Twitter winners
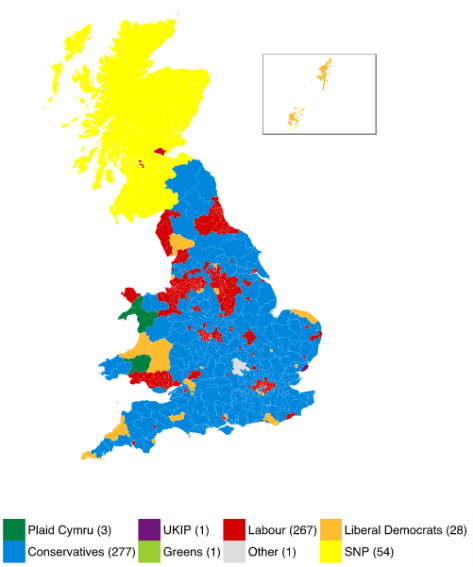
Constituency level prediction from http://www.electionforecast.co.uk/
As you can see the number of seats “won” in the Twitter vote diverges significantly from the electionforecast.co.uk model (which is, of course, much closer to what is actually going to happen), but is nevertheless not entirely unrealistic. Labour are understated to a large degree, whilst the reverse is true for UKIP and the Green Party. Labour, Liberal Democrats and SNP are somewhere within the ball park (+/- 30).
Of course, we didn’t really expect this type of method to offer a perfect “prediction” of the election: it would be a major surprise (and probably a coincidence) if it did. My guess is it indicates more something about the loyal / activist base present in a constituency than voter levels. Hence it will be interesting to see if the seats given to some of the more minor parties using this method are areas where these parties do surprisingly well or beat the national trend. For example, are the 35 Green Party constituencies we highlight places where the Greens manage to make a major improvement on their vote share?