In honor of the anniversary when American colonists kicked out the oppressive British (apologies to Mark and other oppressive Brits) today is the birthday of the United States. Traditionally it is celebrated by attempting to blow up or burn a small part of it with fireworks, and given the dry conditions at the moment, we may very well succeed at this beyond our wildest expectations.
But until #badideaswithfireworks becomes a trending hash tag, we thought we’d use Twitter to explore some of the regional differences that are rending the fabric of society make America great. It also gives us a chance to showcase some of the potential of our nascent DOLLY project (feel free to visit the Knight News Challenge website and comment positively!), which integrates and maps geographic social media and official data sources. DOLLY is still not quite ready for general use, but the backend database is all set which makes it really easy to pull out user generated geocoded data, in this case from Twitter.
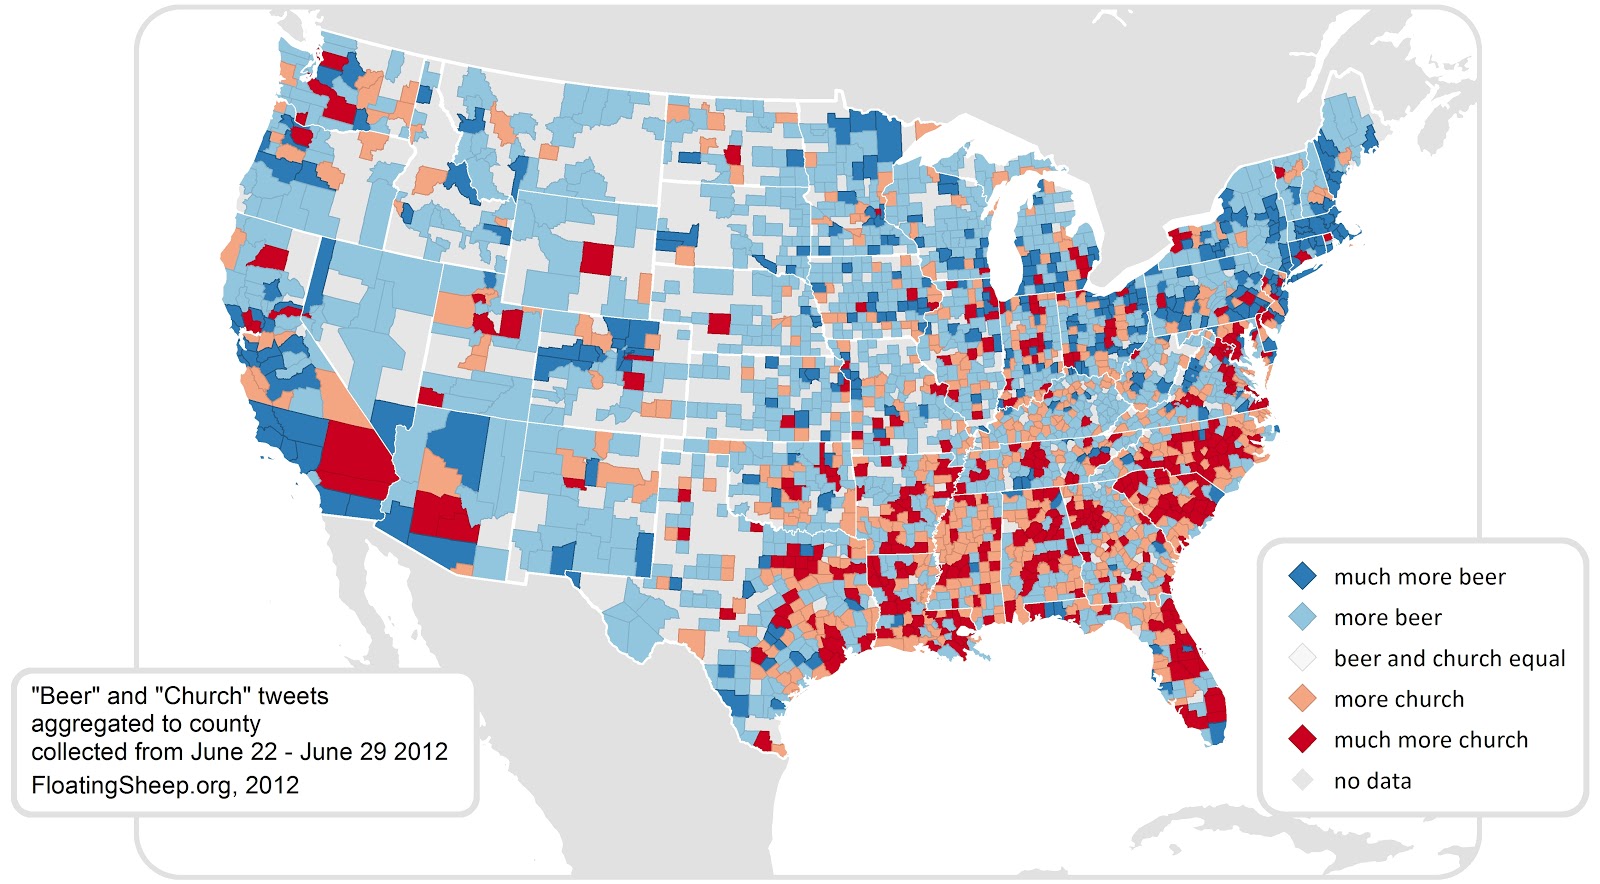
So in honor of the 4th of July, we selected all geotagged tweets[1] sent within the continental US between June 22 and June 28 (about 10 million in total) and extracted all tweets containing the word “church” (17,686 tweets of which half originated on Sunday) or “beer” (14,405 tweets which are much more evenly distributed throughout the week). See below for more technical details[2] or just go straight to the map below to see the relative distribution of the tweets in the U.S.
Relative Number of Tweets containing the terms “church” or “beer” aggregated to the county level, June 22-28, 2012
This map clearly illustrates some fairly big regional divides (more on that in a bit) but it is worth drilling down a bit to see how this plays out at the local level. San Francisco has the largest margin in favor of “beer” tweets (191 compared to 46 for “church”) with Boston (Suffolk county) running a close second. Los Angeles has the distinction of containing the most tweets overall (busy, busy thumbs in Southern California). In contrast, Dallas, Texas wins the FloatingSheep award for most geotagged tweets about “church” with 178 compared to only 83 about “beer.”
Of course, since these are tweets, the content is decidedly less spiritual than one might expect given the focus on beer and church. For example, the most common example of a “church” tweet was simply a report such as “I am at _______ church“. More amusing are what we characterize as “competitive church going” when one person replaces another as the Foursquare “mayor” of a church. “I just ousted Jef N. as the mayor of Dallas Bible Church on @foursquare! 4sq.com/5hNW6x”
This of course echoes the Sermon on the Mount and the famous verse, “Blessed are those who check in for they shall inherit the badges of righteousness.” Another common category were politically related tweets such as “#ICantDateYou If You Dont Go To Church” or “@____ you’re right. It’s like separation of church and state. But they really shouldn’t be separated. #twitterpolitics“.
Given the cultural content of the “church” tweets, the clustering of relatively more “church” than “beer” content in the southeast relative to the north-east suggests that this could be a good way to identify the contours of regional difference. In order to quantify these splits, we ran a Moran’s I test for spatial auto-correlation which proved to be highly significant as well.[3] Without going into too much detail, this test shows which counties with high numbers of church tweets are surrounded by counties with similar patterns (marked in red) and which counties with many beer tweets are surrounded by like-tweeting counties (marked in blue). Intriguingly there is a clear regional (largely north-south split) in tweeting topics which highlights the enduring nature of local cultural practices even when using the latest technologies for communication.
We also note that this map strongly aligns with the famous ‘red state’/’blue state’ map from the 2000, 2004, and 2008 elections with a strong “religious right” component in the Southeastern United States (see also The Virtual ‘Bible Belt’) and a more liberal, or at least beer-tweeting, Northeast and upper Midwest (see also The Beer Belly of America).
In any case, happy 4th of July to our American readership. We hope you enjoy your beer in the north, or your church service if you are tweeting from the south.
———————-
[1] It is important to note that geotagged tweets are somewhat of an oddity among tweets, as only one to three percent of tweets (depending on the country) are geotagged. Still a small percentage of a very large number (the total number of tweets) results in a LOT of data.
[2] There are a number of technical issues tied to the validity and scale of geography associated with tweets which we won’t go into here but it is worth mentioning that we are NOT using user profile locations. This data is limited to geographic information associated with each tweet, often drawn from a GPS capable device. While the relevant scale at which analysis can be done differs between tweets about 90 percent of the tweets in this sample are accurate on the city level or lower which works well for this analysis.
[3] Based on IDW matrix for 2.34 decimal degrees (Euclidean distance), this test achieved a z-score of 14.34, implying there is a less than 1% likelihood that this high-clustered pattern could be the result of random chance.