Skip down to main content

Mapping Wikipedia Article Quality in North America

Published on
13 Dec 2011
Written by
Mark Graham
The maps of Wikipedia previously posted on the blog offer useful insights into the geographies of one of the world’s largest platforms for user-generated content. They, along with similar visualizations, reiterated some of the massive inequalities in the layers of information that augment our planet.

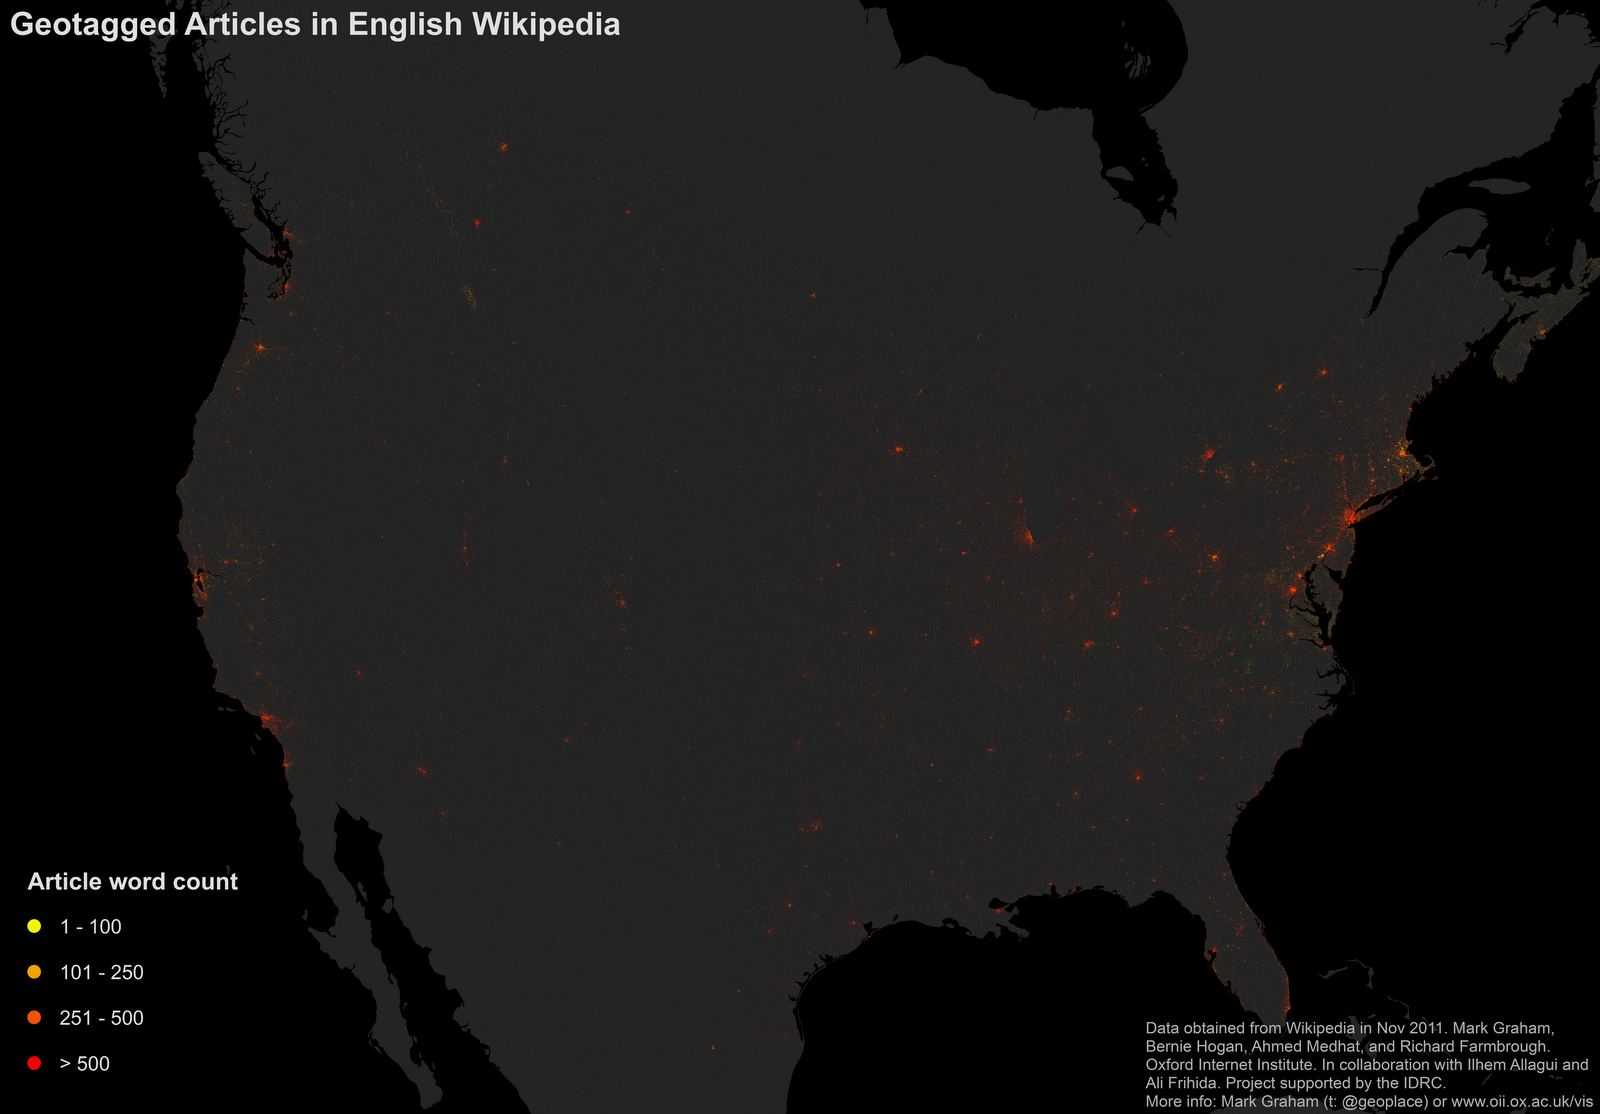
But not all articles are created equally, and those maps didn’t give us much of a sense of the quality of articles. “Quality” is obviously a slippery word and there are infinite ways of measuring it, but for the purposes of this post, we’ll crudely use the term to refer to article length (future maps will employ a variety of other metrics).

The maps below visualize this measure of quality within Wikipedia entries — yellow dots represent the location of relatively short articles in the English version of Wikipedia (e.g. the article on “Bandana, Kentucky“), while red dots indicate the location of relatively long articles (e.g. the articles on the “Republic of Molossia“.
The map below displays the same data, but with smaller dots: making it easier to see some of the patterns if you expand the image.

Interestingly, the states with the highest average word counts are New Jersey (966) and Michigan (914). The states with the lowest averages are Delaware (534) and West Virginia (492). The reasons for these rather large differences are unclear.

Are Wikipedians from New Jersey that much more loquacious than their West Virginian counterparts? Or does it just take more words to describe the many dazzling wonders of New Jersey? Or is it something else entirely?

Apart from the obvious and increasingly evident urban bias in these information geographies, we’d certainly welcome your thoughts in explaining some of these patterns.

Related Topics:

Privacy Overview
Oxford Internet Institute

This website uses cookies so that we can provide you with the best user experience possible. Cookie information is stored in your browser and performs functions such as recognising you when you return to our website and helping our team to understand which sections of the website you find most interesting and useful.

Strictly Necessary Cookies
  • moove_gdrp_popup -  a cookie that saves your preferences for cookie settings. Without this cookie, the screen offering you cookie options will appear on every page you visit.

This cookie remains on your computer for 365 days, but you can adjust your preferences at any time by clicking on the "Cookie settings" link in the website footer.

Please note that if you visit the Oxford University website, any cookies you accept there will appear on our site here too, this being a subdomain. To control them, you must change your cookie preferences on the main University website.

Google Analytics

This website uses Google Tags and Google Analytics to collect anonymised information such as the number of visitors to the site, and the most popular pages. Keeping these cookies enabled helps the OII improve our website.

Enabling this option will allow cookies from:

  • Google Analytics - tracking visits to the ox.ac.uk and oii.ox.ac.uk domains

These cookies will remain on your website for 365 days, but you can edit your cookie preferences at any time via the "Cookie Settings" button in the website footer.