One common criticism of the otherwise excellent ggplot2 is that it doesn’t come with network visualisation capability. Network vis is so popular at the moment that it seems like a bit of a big omission; but network data is also quite unique in terms of structure (and the layout algorithms would need implementing) so I can see why it hasn’t been integrated.
Moritz Marbach has a great post explaining how to easily get ggplot2 up and running with network data. It was still one of the top hits on Google when I checked it out recently for a project. However the post is from 2011 so is getting a little dated – it uses the sna package rather than igraph (which seems to be becoming a standard for network science) and also has a few deprecated ggplot2 commands in it. So I thought I’d add a bit of an update here to the code.
As Marbach explains the secret to getting ggplot2 to draw networks is quite simple: get a network analysis package to give you a list of nodes, edges, and node layout information as a series of X,Y coordinates. Then you can simply plot the nodes with geom_point and the edges with geom_segment. Put together it looks something like this:
library(igraph)
g = read.graph("a-network.gml", format="gml")
#get the node coordinates
plotcord <- data.frame(layout.fruchterman.reingold(g))

colnames(plotcord) = c("X1","X2")
#get edges, which are pairs of node IDs

edgelist <- get.edgelist(g)
#convert to a four column edge data frame with source and destination coordinates

edges <- data.frame(plotcord[edgelist[,1],], plotcord[edgelist[,2],])

colnames(edges) <- c("X1","Y1","X2","Y2")
ggplot() + geom_segment(aes(x=X1, y=Y1, xend = X2, yend = Y2), data=edges, size = 0.5, colour="grey") + geom_point(aes(X1, X2), data=plotcord)
Output:
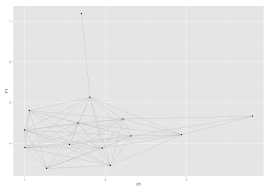
OK it still needs some work! But anyone familiar with ggplot2 can do the rest.