What do data scraped from the Internet tell us about a range of social, economic, political, and even environmental processes and practices? As ever more people take to social media to share and communicate, we are seeing that the data shadows of any particular story or event become increasingly well defined.
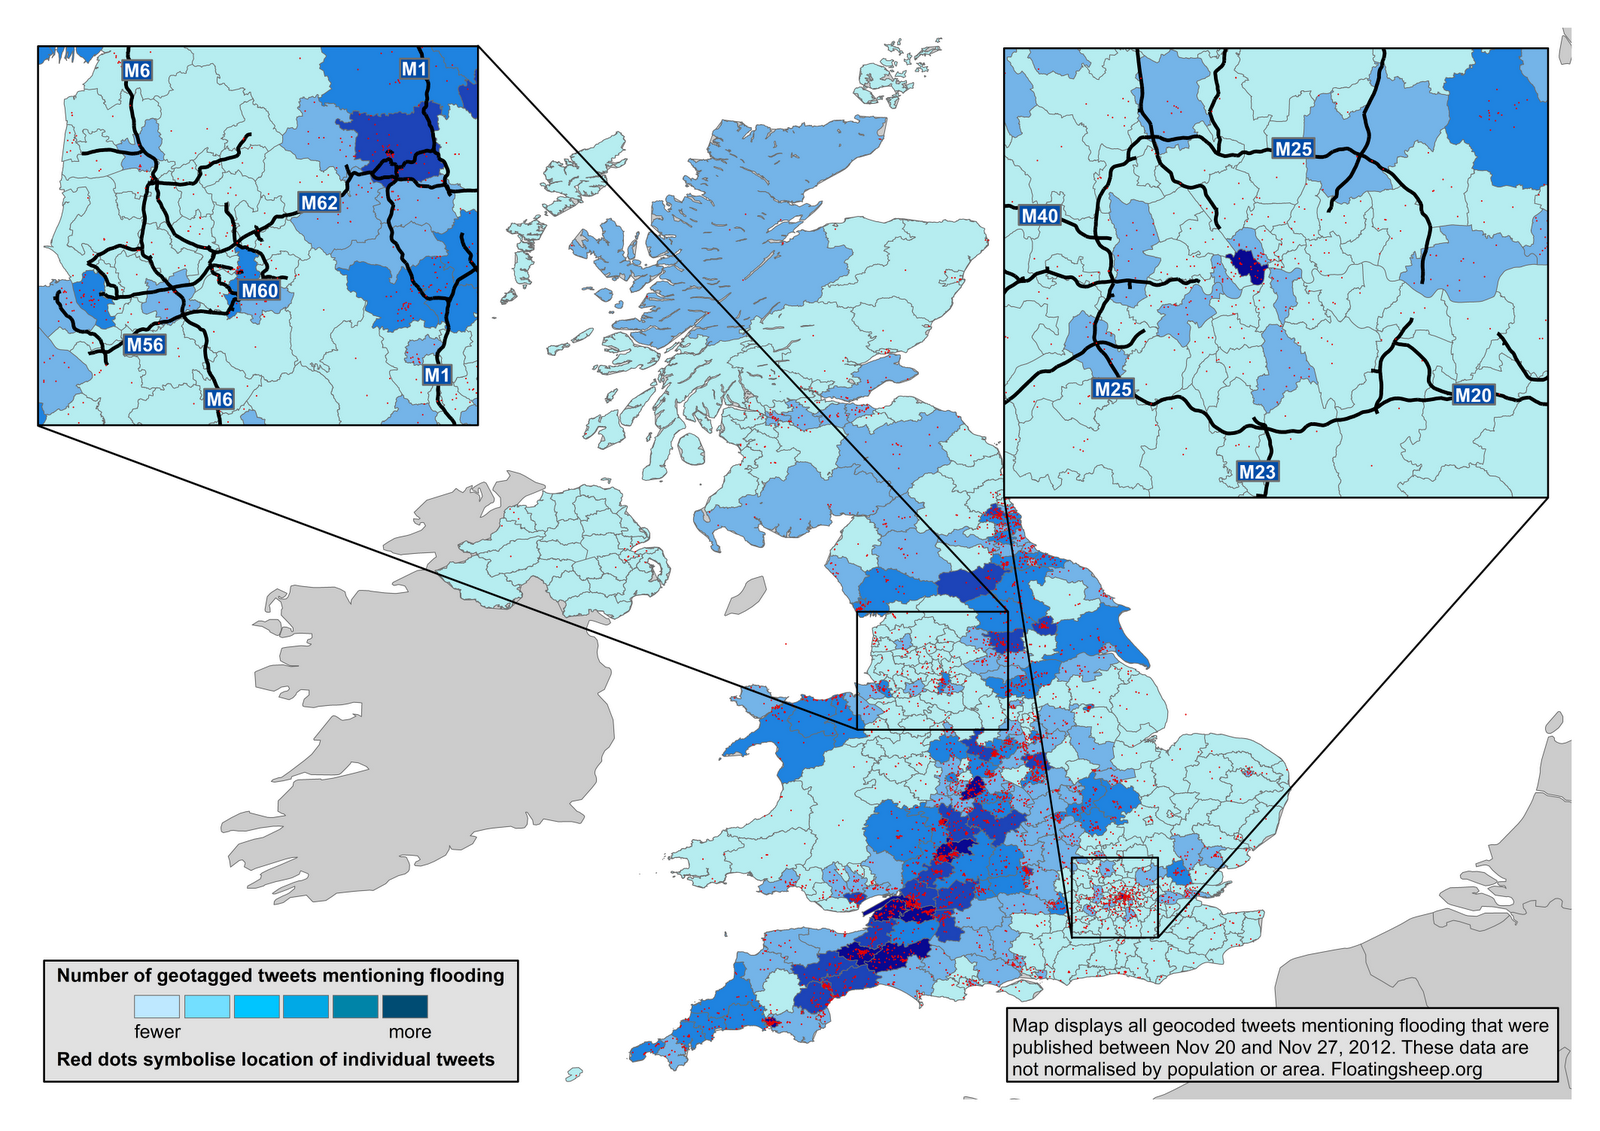
The ongoing UK floods offer a useful example of some of the links between digital data trails and the phenomena they represent. In the graphics below, we mapped every geocoded tweet between Nov 20 and Nov 27, 2012 that mentioned the word “flood” (or variations like “flooded” or “flooding”).
Unlike many maps of online phenomena (
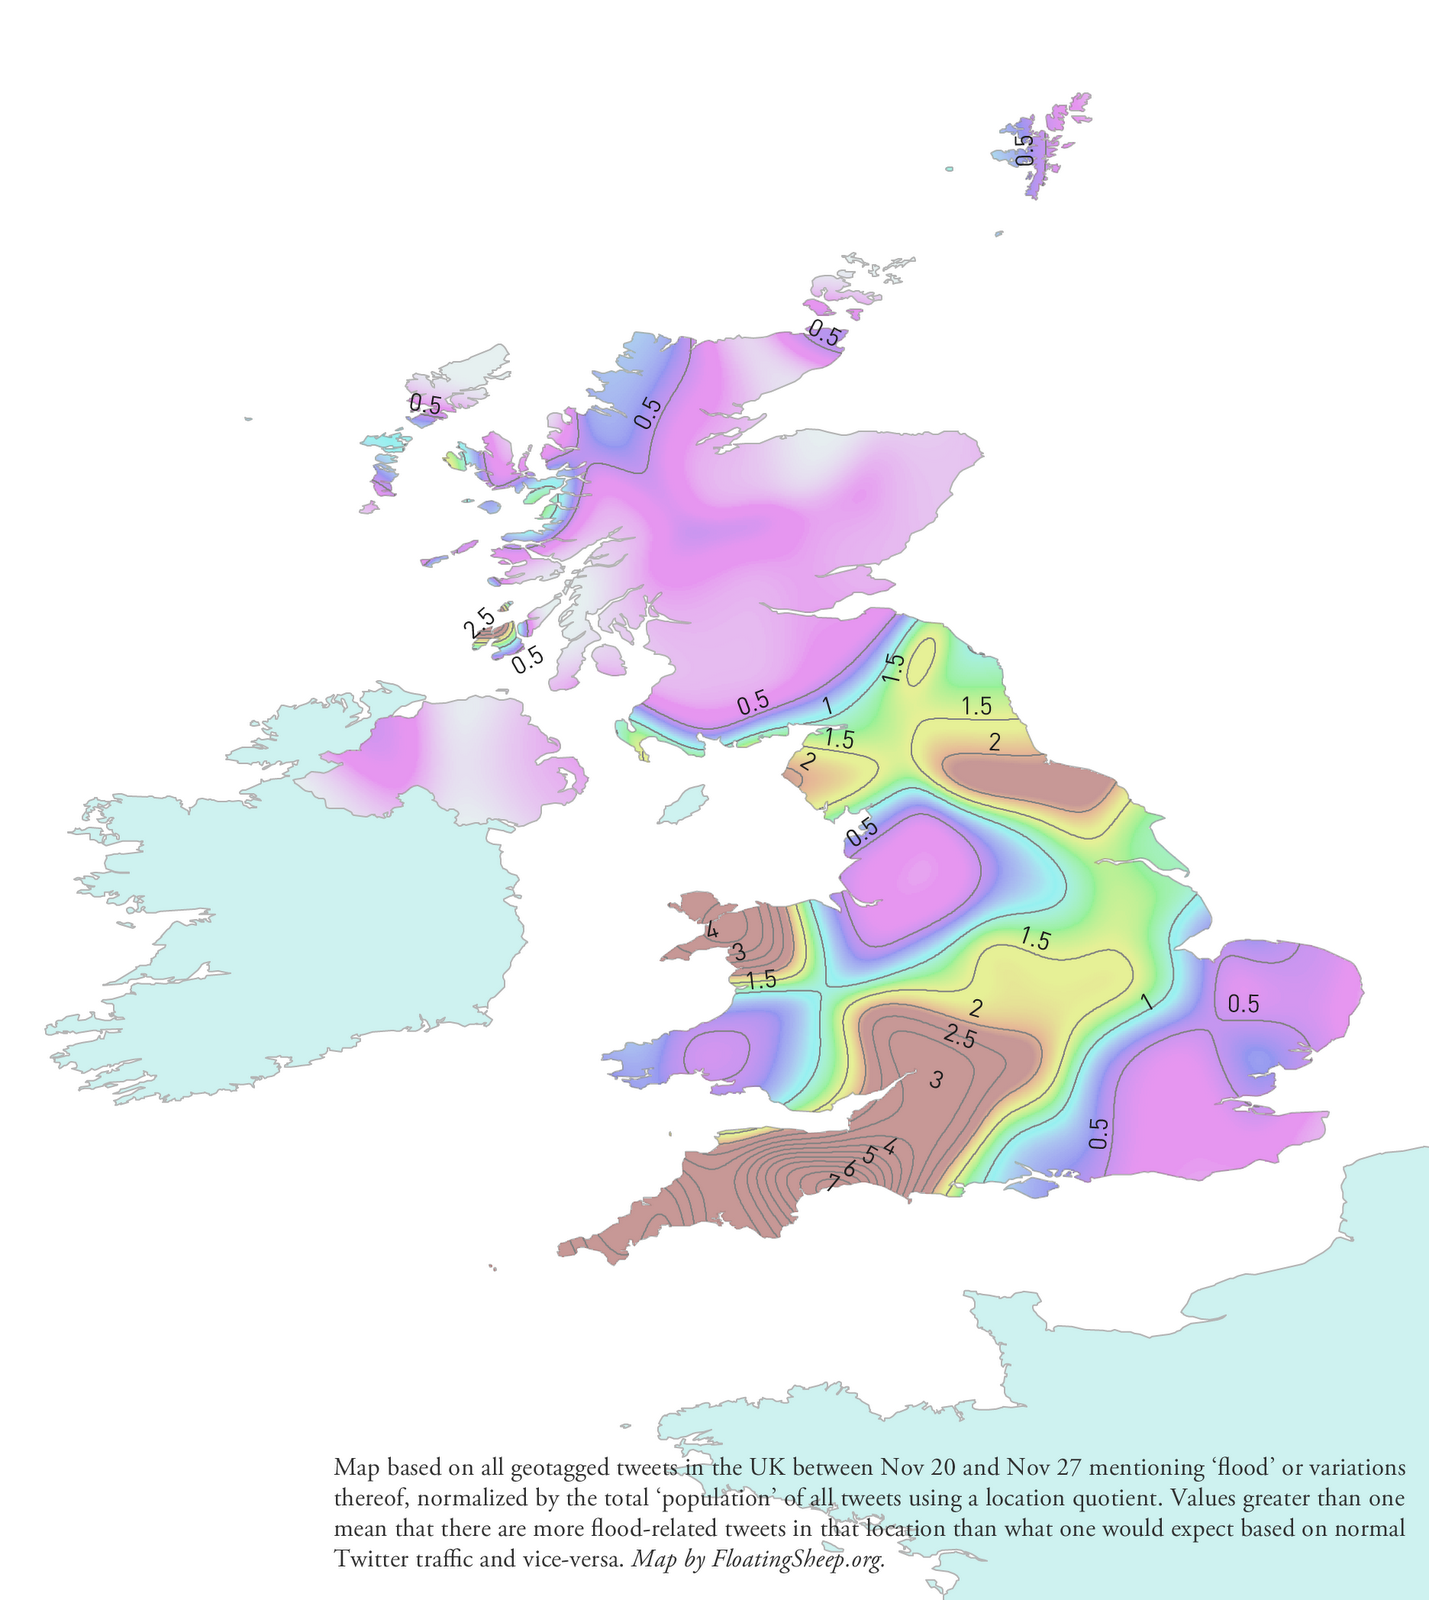
relevant XKCD),careful analysis and mapping of Twitter data does NOT simply mirror population densities. Instead concentration of twitter activity (in this case tweets containing the keyword flood) seem to closely reflect the actual locations of floods and flood alerts even when simply look at the total counts. This pattern becomes even clearer when we do normalise the map (the second map is a location quotient where everything greater than 1 indicates that there are more tweets related to flooding than one would expect based on normal Twitter usage in that area), the data even more closely mirror the UK Environment Agency’s flooding map.
As we demonstrated with our maps of
Hurricane Sandy, it is important to approach these sorts of maps with caution. At least in the
information-dense Western world, they are often able to reflect the broad contours of large phenomena. But, because we are still necessarily measuring subsets of subsets, our big data shadows start to
become quite small and unrepresentative at more local levels. This is particularly an issue when the use of the relevant technology is unevenly distributed across demographic sectors such as was the
case in post-Katrina New Orleans.
Nonetheless, with every new large event, movement, and phenomena, we are undoubtedly going to see a much more research into both the potentials and limitations of mapping and measuring digital data shadows. This is because physical phenomena like hurricanes and floods don’t just leave physical trails, but create digital ones as well.