Skip down to main content

Interactive Maps

Published on
5 Nov 2012
Written by
Scott A. Hale

Update: 6 November 2012 – US map featured in the Guardian.

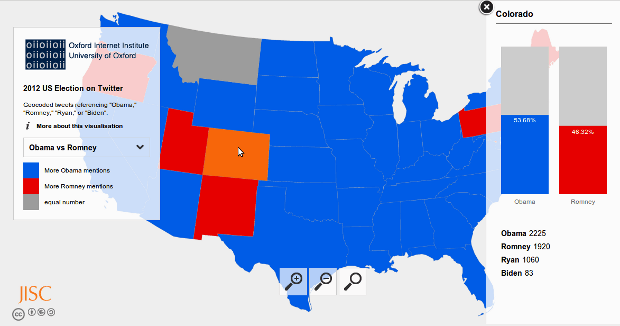
I’ve not blogged for a while on this site, because I’ve been doing lots of blogging on the InteractiveVis project site. InteractiveVis is a project to create easy to use tools to build HTML5 interactive visualizations. These tools will be public very soon, but in the meanwhile, please enjoy some demonstrations of the types of visualizations users of the tools can create. The last demo using mentions of US Presidential candidates on Twitter is particularly timely (it remains to be seen how accurate!).

Demo 1: Visualization of followers at @OIITwitter

Background information about this visualization

Demo 2: Visualization of UK Central Government

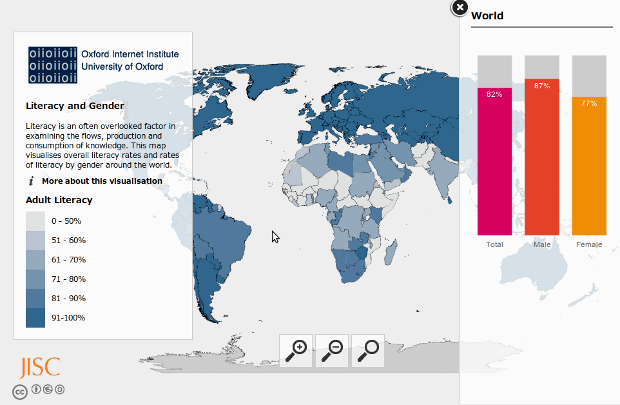
Demo 3: Visualization of Literacy and Gender

Background information about this visualization

Demo 4: US Elections on Twitter
Background information about this visualization