8 Apr 2014
by Jonathan Bright and Taha Yasseri.
When do people start getting interested in elections, and how does this differ in different countries? In this post we try to get a handle on this question looking at data drawn from Wikipedia. Wikipedia is a useful resource because it has editions in a huge variety of languages, even if the absolute penetration of each varies.
We pull out information on daily readership statistics for the Wikipedia article on the European Parliament election, 2009 for May and June. The election itself was held between 4-7 June in the 27 member states of the EU. We look at 19 different language versions of the article, all of which are either official EU languages or at least widely spoken in one region. As most of the languages we look are roughly unique to one European country (with some caveats) this gives us an idea of how public attention to the issue of the election builds up and then decays past election time in each country.
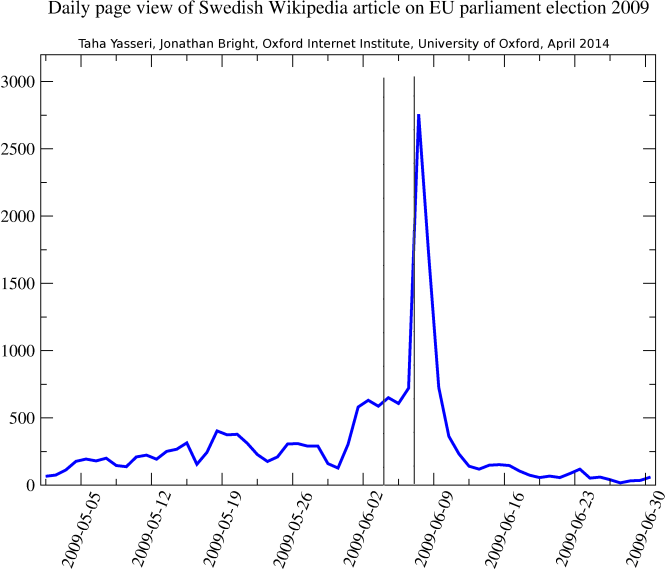
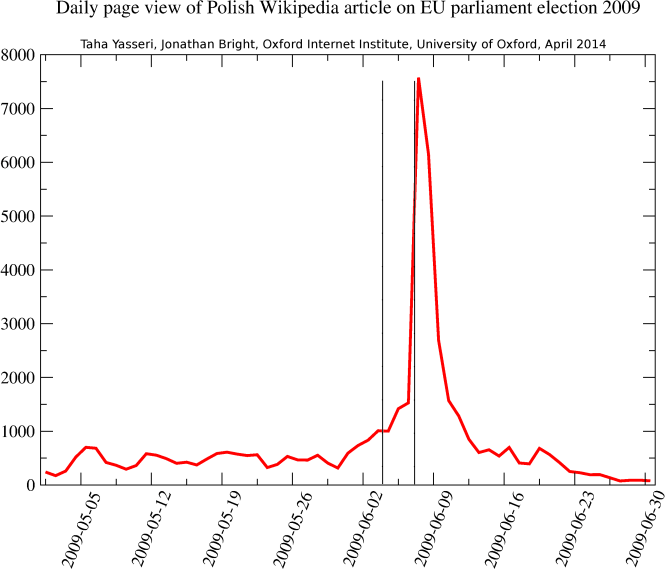
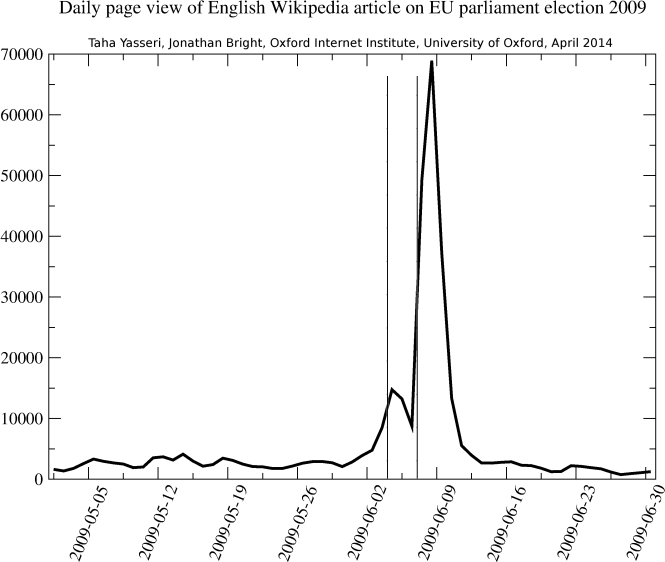
The figures above shows the case of Swedish, Polish and English Wikipedias by way of example. The overall picture can be broken down into three periods: pre-election, the moment of the election itself, and post-election. Several things are worth highlighting. First, although there is clearly some activity before election time, there isn’t really a “build up” until just a few days before the election. Second, the peak in activity broadly coincides with the election itself, but actually falls just after it. Thirdly, attention decays very quickly after the peak back towards the base level. However note that the height of the peak can vary significantly from one language to another.
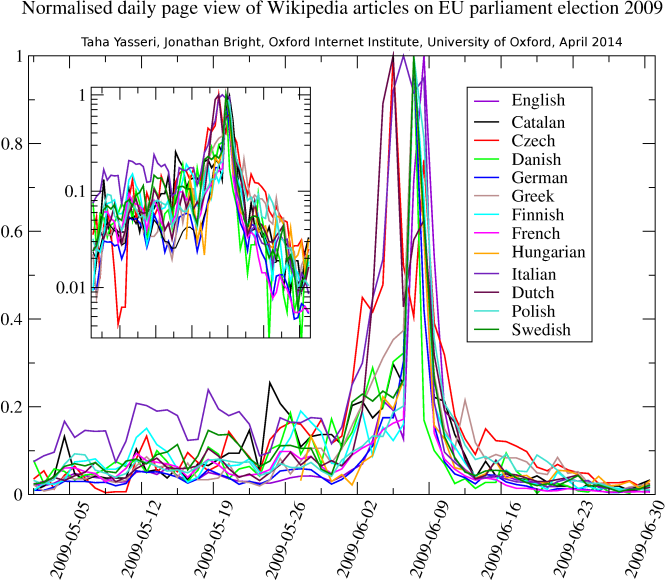
Out of the 19 language editions that we have studied, 13 + English follow this three stage pattern very closely. The figure above shows a curve collapse for these 13 language editions after normalisation to the maximum of the daily page view of each language (in the next post we will focus on the 5 remaining outlier language editions).
We speculate that this graph shows the majority of electoral information seeking occurs in response to publicity generated by media events, and hence reflects the continued importance of the mainstream media for the functioning of democracy. Somewhat paradoxically however, these media seem to stimulate major public interest in the European Parliament elections only after they take place, rather than pushing people to inform themselves before participating.
For our purposes, the next question is of course whether the height of the peaks, which represents several thousand individuals going to the page at election time, corresponds to any electoral outcomes (e.g. turnout). We will tackle this in a future post.


