Now that over half of humanity is connected to the internet, do we see greater levels of representation of, and participation from, previously digitally disconnected populations? Or are our digitally dense environments continuing to amplify inequalities rather than alleviate them? Our team is examining digital geographies at global, national and urban scales. This website serves as a visual gallery of our work. Learn more about our work and our team.
EXPLORE OUR GEOGRAPHICS
-
-
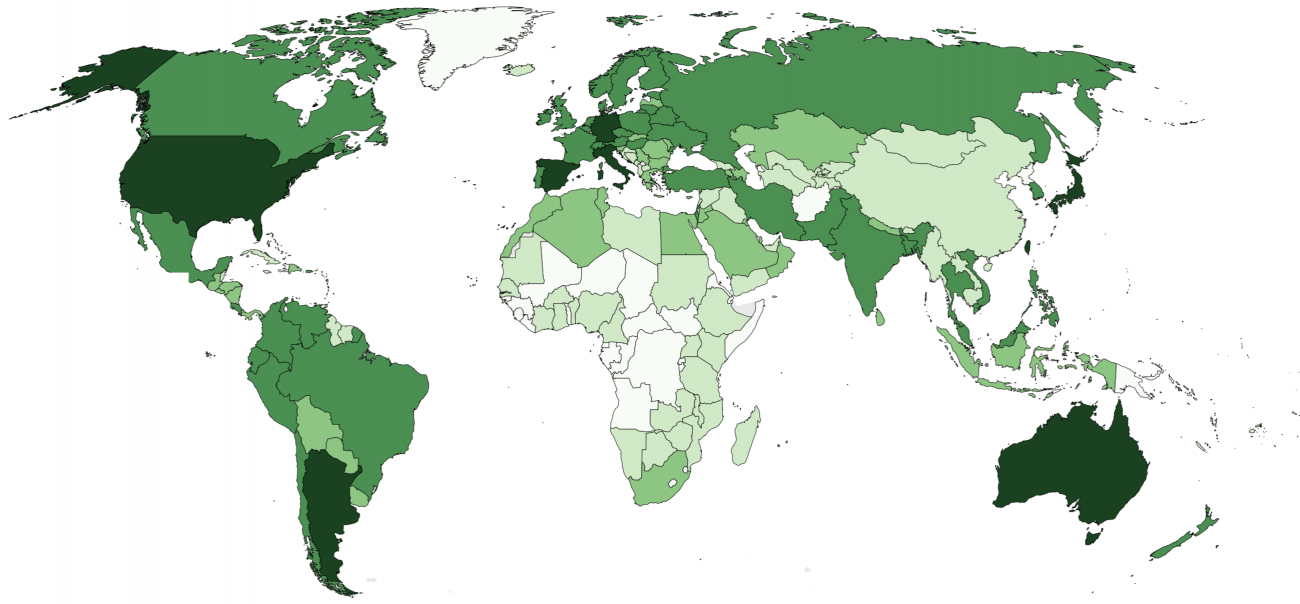 New maps show that Wikipedia's representations of the world remain highly uneven.The Uneven Geography of Wikipedia
 -
![Why is [x] so rich / poor?](https://geography.oii.ox.ac.uk/wp-content/uploads/sites/6/2018/03/RichPoorMap.png) These maps show what properties Google Autocomplete adds to 'Why is so...'The World as Seen by a Search Algorithm
These maps show what properties Google Autocomplete adds to 'Why is so...'The World as Seen by a Search Algorithm -
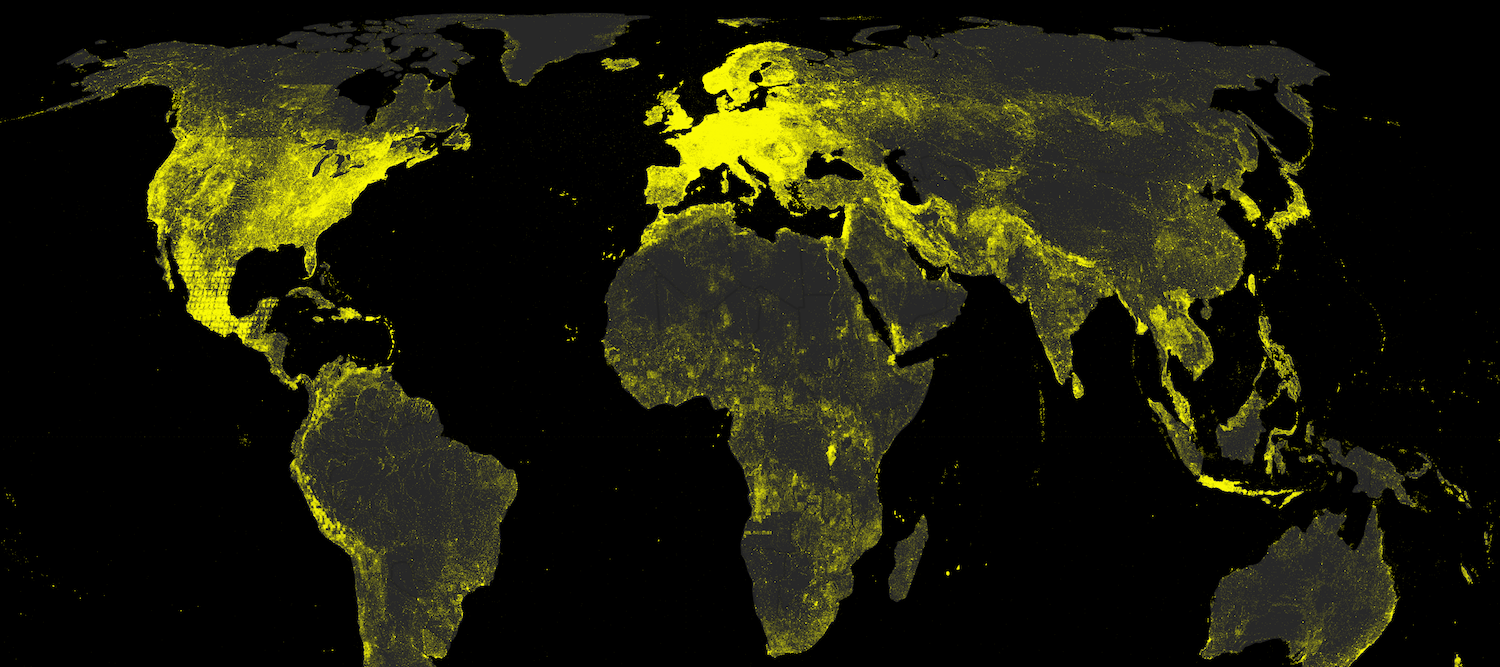
 This map points out the highly uneven spatial distribution of (geotagged) Wikipedia articles.Geographically Uneven Coverage of Wikipedia
 -
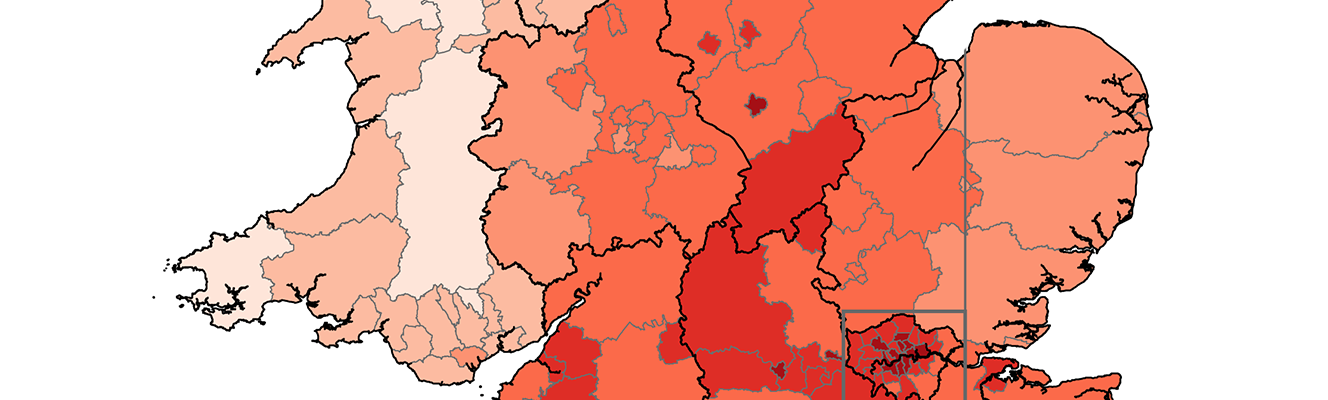 The map shows percentage of Internet users in local authority districts across Britain.Internet Use in Britain
 -
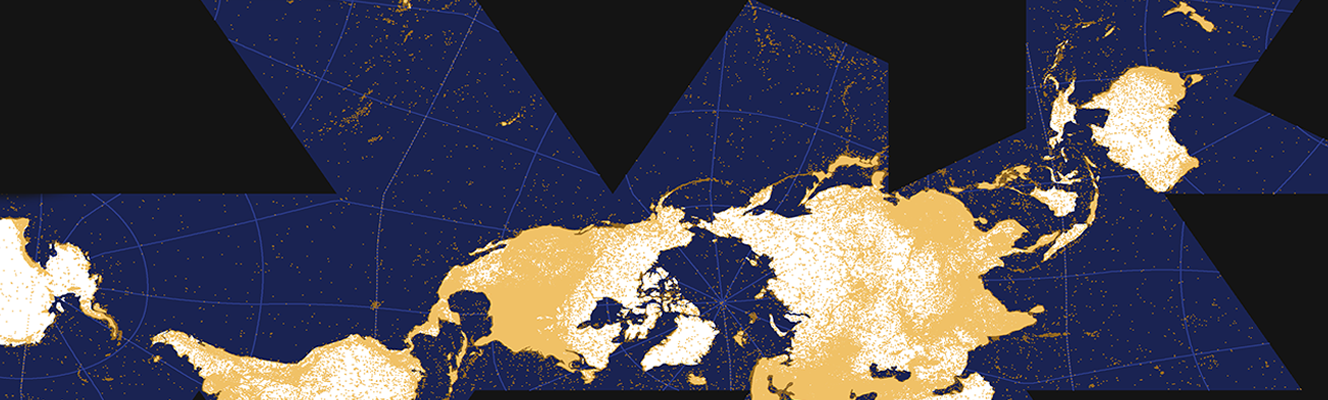
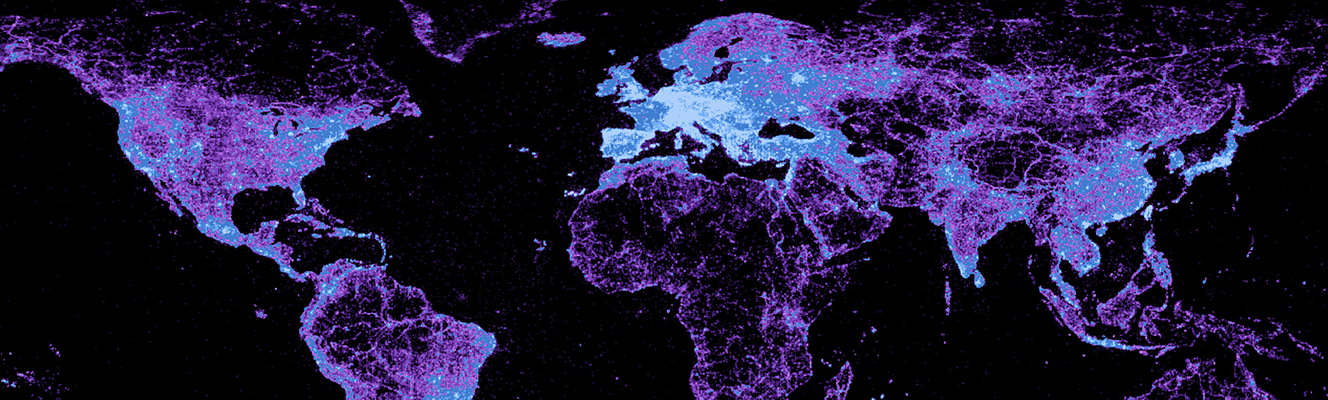 This map represents the location of photographs on one of the largest photo-sharing web platforms.A World's Panorama